
Creating Beautiful River Maps with Python featured by Towards Data Science
This article was written by Geollect’s very own Adam Symington and featured on Towards Data Science. Below is the intro with a full link to the article below
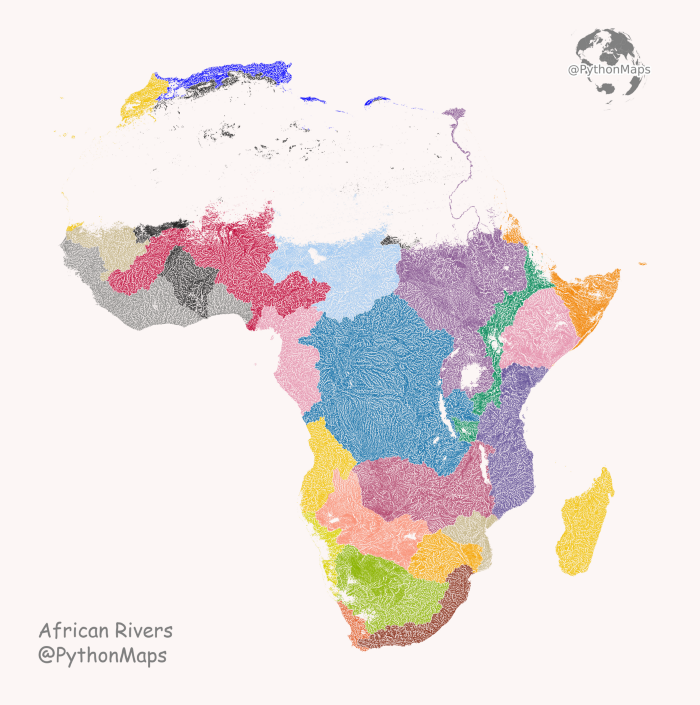
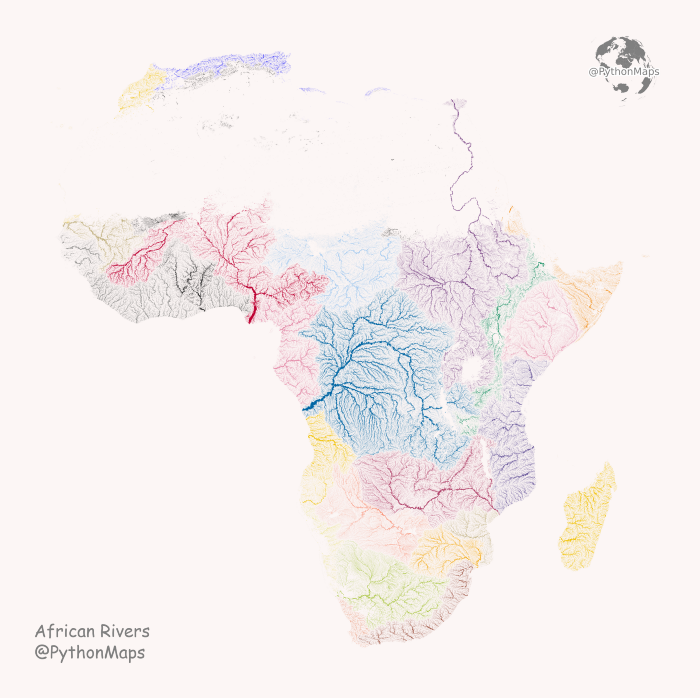
Rivers and the water cycle have always been central to human civilisation and were a topic that particularly fascinated me in school. Thanks to some amazing research projects there are now a series of databases that allow you to explore geospatial river data and with the magic of Python, transform it into some really eye catching visualisations. Like the image above which shows the rivers of Africa, coloured according to their river basin.
While data visualisation is the aim of the game so to speak, this is an exercise with data manipulation and spatial joins at its core. We will merge data from a few different sources to generate the visualisation above as well as some other interesting plots.
There are a couple of different open source datasets that are available. The most well known is the Hydrosheds database, which is a river database derived from the digital elevation model of the Shuttle Radar Topography Mission (SRTM) at a pixel resolution of 3 arc-seconds. The data was generated using a mixture of optimisation algorithms and human quality control. Essentially, the model derives water channels from digital elevation data. In the future I will write more on the Hydrosheds data, however at the time of writing the Hydrosheds 2.0 project is nearing completion and it would be a shame to write something that immediately becomes outdated. Furthermore, the data is so detailed that runtimes on any sort of analysis code are huge, so for beginners interested in this topic it may not be appropriate and best left for another time (this tutorial will still be appropriate for users who delve into the hydrosheds data in spite of my warnings).
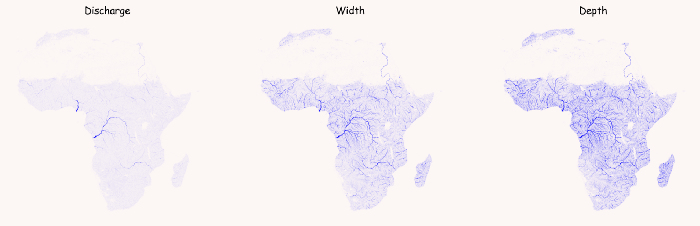
With this in mind I have explored a number of derived datasets that are based on the hydrosheds data. It is one of those that will be used for the visualisations in this article, namely, the global rivers database published in Water Resources Research in 2013 (link). In this work, the authors use both the hydrosheds data and hydraulic geometry methods to derive bankfull depth and width to a relatively high degree of accuracy. Bankfull discharge is commonly thought of as the flow that fills the channel up to the top of banks, prior to flooding……..