Creating Beautiful Population Density Maps with Python featured by Towards Data Science
This article was largely inspired by the subreddit r/peopleliveincities. Humans have spread themselves far and wide across Planet Earth, touching every continent and casting their impact across vast swathes of the world. However when you actually look at population density maps you tend to find that the majority of people cluster themselves together, in spite of the vast, empty spaces around the world.
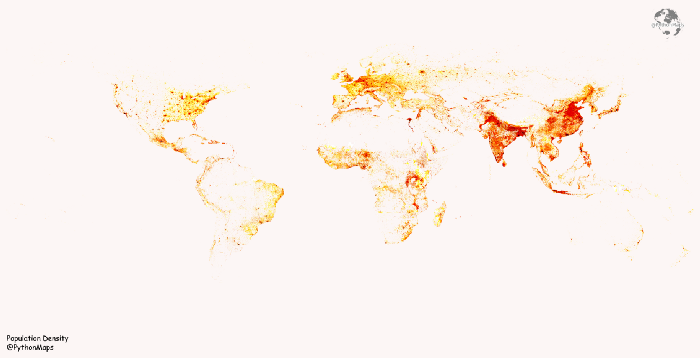
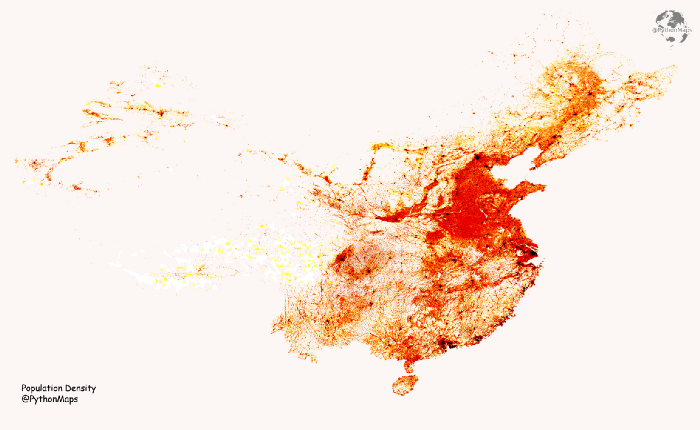
If the population of the world was spread evenly then there would be roughly 50 people per square kilometre. In reality there are areas that are completely unpopulated and entire countries with population densities of thousands of people per square kilometre. This is a genuinely fascinating concept and with the right population density map you can pick out individual cities, towns and even villages as well as identify the worlds truly remote areas.
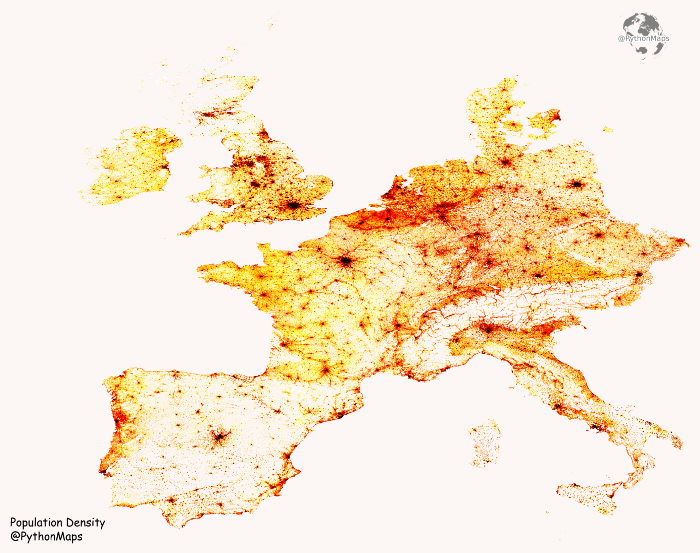
This is what you are seeing in the cover image, dark hotspots denoting densely populated cities and towns mixed amongst lighter areas with very few people. So in this article I am going to outline how you can use open source population density data to build your own population density maps using Python.